


Business overview №╝ѕNon-Consolidated ,JGAAP№╝Ѕ
Financial Highlights(Non-Consolidated)
№╝ѕunit№╝џmillion yen№╝Ѕ
| 2022.3 | 2023.3 | 2024.3 | 2025.3 | 2026.3 | |
|---|---|---|---|---|---|
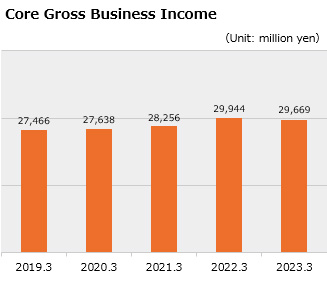
| Core Gross Business Income | 29,944 | 29,669 | 27,309 | 27,882 | 32,205 |
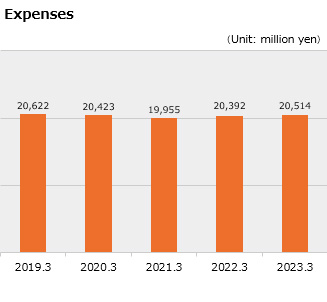
| Expenses | 20,392 | 20,514 | 20,742 | 21,270 | 21,764 |
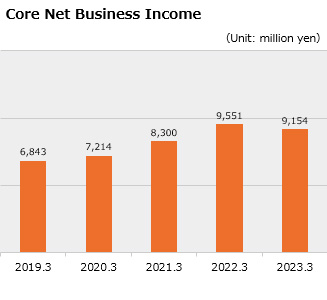
| Core Net Business Income | 9,551 | 9,154 | 6,567 | 6,611 | 10,441 |
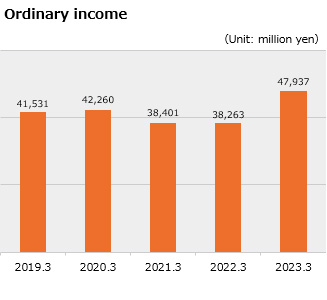
| Ordinary income | 38,263 | 47,937 | 60,558 | 60,986 | 62,954 |
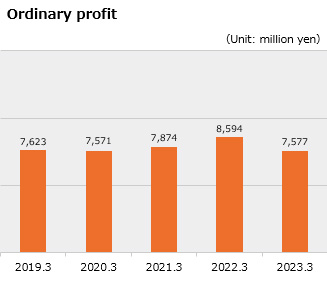
| Ordinary profit | 8,594 | 7,577 | 7,080 | 7,084 | 9,866 |
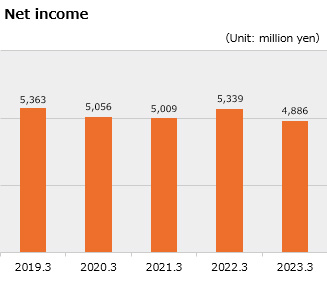
| Net income | 5,339 | 4,886 | 4,509 | 5,216 | 6,690 |
Financial Data(Non-Consolidated)
№╝ѕunit№╝џmillion yen№╝Ѕ
| 2022.3 | 2023.3 | 2024.3 | 2025.3 | 2026.3 | |
|---|---|---|---|---|---|
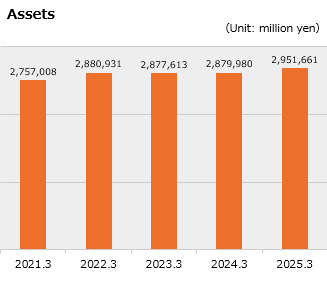
| Assets | 2,880,931 | 2,877,613 | 2,879,980 | 2,951,661 | 3,071,497 |
| Loans and bills discounted | 1,837,020 | 1,927,517 | 1,942,443 | 1,982,671 | 2,020,785 |
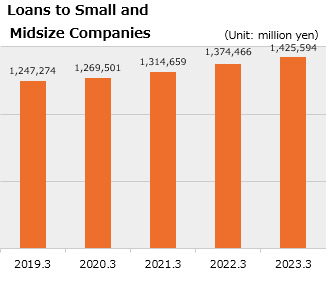
| Loans to Small and Midsize Companies | 1,374,466 | 1,425,594 | 1,448,069 | 1,454,088 | 1,434,212 |
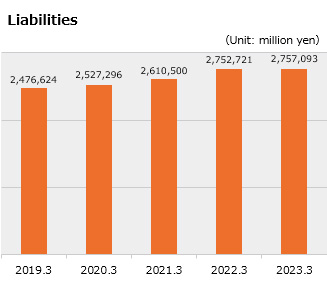
| Liabilities | 2,752,721 | 2,757,093 | 2,750,538 | 2,824,334 | 2,937,170 |
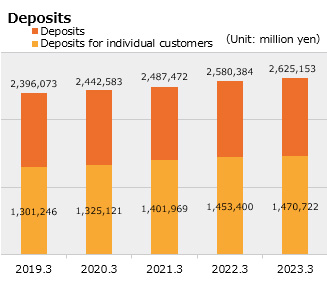
| Deposits | 2,580,384 | 2,625,153 | 2,650,772 | 2,707,932 | 2,784,324 |
| Deposits for individual customers | 1,453,400 | 1,470,722 | 1,475,982 | 1,483,268 | 1,487,220 |
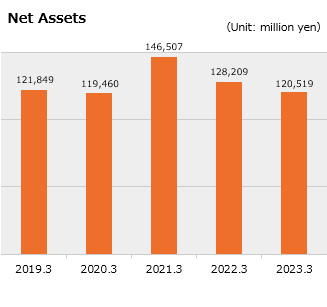
| Net Assets | 128,209 | 120,519 | 129,441 | 127,326 | 134,326 |
Management Indices(Non-Consolidated)
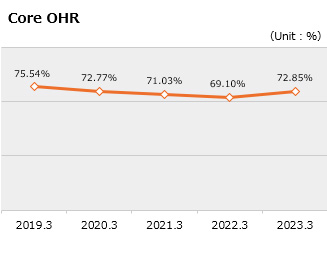
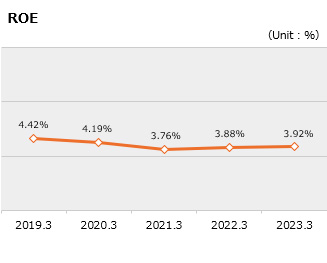
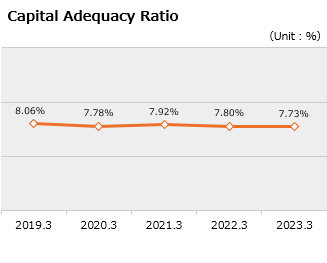
| 2022.3 | 2023.3 | 2024.3 | 2025.3 | 2026.3 | |
|---|---|---|---|---|---|
| Core OHR | 68.10% | 69.14% | 75.95% | 76.29% | 67.57% |
| ROE | 3.88% | 3.92% | 3.60% | 4.06% | 5.11% |
| Capital Adequacy Ratio | 7.80% | 7.73% | 7.77% | 8.10% | 8.19% |
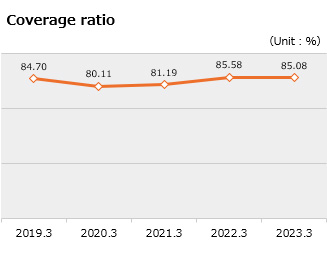
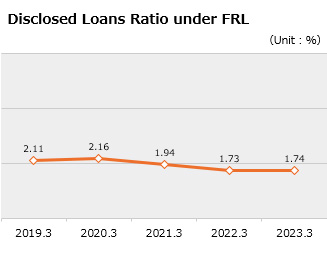
Nonperforming Loan (non-consolidated)
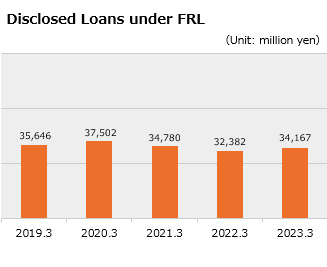
№╝ѕunit№╝џmillion yen№╝Ѕ
| 2022.3 | 2023.3 | 2024.3 | 2025.3 | 2026.3 | |
|---|---|---|---|---|---|
| Disclosed Loans under FRL | 32,382 | 34,167 | 39,141 | 34,851 | 33,865 |
| Coverage ratio | 85.58% | 85.08% | 82.25% | 77.07% | 77.31% |
| Disclosed Loans Ratio under FRL | 1.73% | 1.74% | 1.98% | 1.73% | 1.65% |
FRL : the Financial Reconstruction Law